Several months into the Wuhan coronavirus pandemic, it is reasonable to continue to ask whether the social-economic response to the pandemic has been proportional to the health impact of the pandemic within the United States.
This raises the question about how to measure both impacts. We use two weekly measures provided by the federal government.
The CDC compiles data for the weekly total number of deaths from all causes during a flu season, which is one year measured from October 1 to September 30. We compare this number to the weekly total number of deaths from all causes averaged during the preceding six years (2013-2019), adjusted for the size of the population, expressing the result as a ratio in percent terms.
The US Labor Department compiles a statistic called the insured unemployment rate, which measures the fraction of the unemployment-insured labor force that is continuing to collect unemployment benefits. This number is smaller than the better-known unemployment rate, but it is reported weekly. We compare this number to the insured unemployment rate reported for several months before the pandemic, a record low of 1.2%, expressing the result as a ratio in percent terms.
Lastly, we compute the ratio of the two ratios above, which tells us how far the impact of governmental policy responses has hit the economy relative to the size of the health impact. The results are shown below.
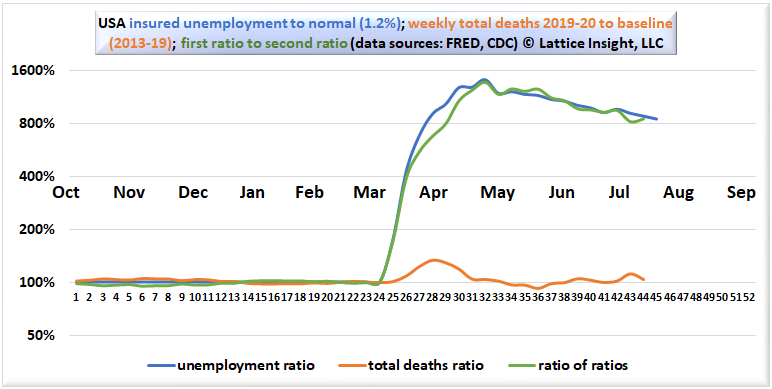
The total deaths ratio hit its maximum value of 134% during mid-April; that is, during one week, there were 34% more deaths than normal. Since early May, however, total deaths per week from all causes have returned to approximately normal. It would be reasonable to say that the pandemic has ended, unless for some reason people have stopped dying from cardiovascular disease and cancer.
The unemployment ratio hit its maximum value of 1425% during mid-May; that is, during one week, the insured unemployment rate was 14.25 times its normal value. As of early August, the latest complete data available, this ratio stands at 850%.
The ratio-of-ratios, the measure of disproportionate response, hit a maximum of 1368% during mid-May, and its most recent value in early August was 848%. This suggests that the drastic impact of policy choices on the economy far outweighs the danger posed by the coronavirus.
 RSS Feed