
Voters will start speaking their minds shortly in caucuses and primaries across America. Among the many issues one weighs when voting is a pragmatic one: which candidate is best positioned to win the general election? The answer to that question is complex. For simplicity, we decided to look at the results of national head-to-head polls between the two leading Democrat presidential candidates versus the five leading Republican presidential candidates.
This data was obtained January 28, 2016 from Huffington Post Pollster, which tracks a more comprehensive set of polls than does Real Clear Politics. We chose "More smoothing" to remove noise; we removed polls based on live phone interviews, which seem to be less reliable than other forms of polling, according to a study by Morning Consult; and we removed polls of all adults, focusing on polls of likely voters and registered voters alone. The numbers in the table represent the comparative percent advantage of the Democrat candidate over the Republican candidate.
On average, the Democrats have a 2-3 percent advantage over Republicans. This varies by candidate. The obvious outlier is the Carson-Sanders match-up. This is probably an artifact of the fact that only one poll made it through our filters, so the point estimate is probably unreliable.
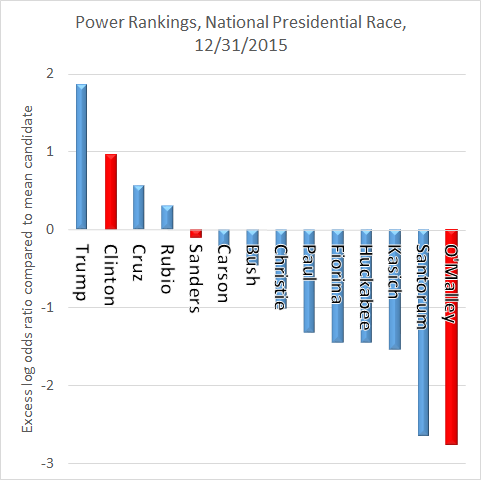
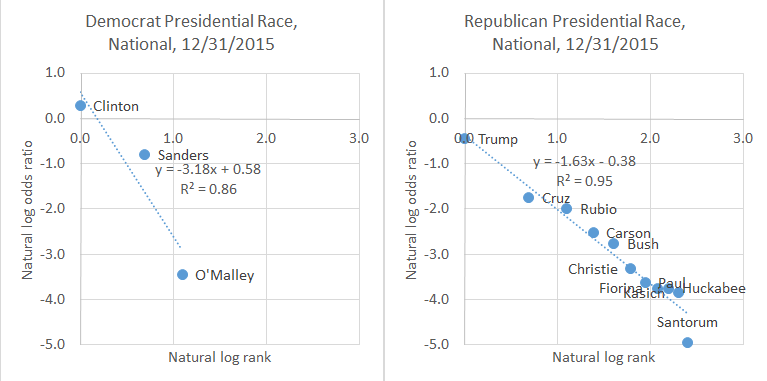
On average, there is little difference between the performance of the two Democrat candidates. The Republican candidates are ordered in the table in order of increasing strength. Trump has the best average performance against the Democrat field. In turn, Clinton has a better chance of beating Trump than does Sanders. See the chart below.
This data was obtained January 28, 2016 from Huffington Post Pollster, which tracks a more comprehensive set of polls than does Real Clear Politics. We chose "More smoothing" to remove noise; we removed polls based on live phone interviews, which seem to be less reliable than other forms of polling, according to a study by Morning Consult; and we removed polls of all adults, focusing on polls of likely voters and registered voters alone. The numbers in the table represent the comparative percent advantage of the Democrat candidate over the Republican candidate.
On average, the Democrats have a 2-3 percent advantage over Republicans. This varies by candidate. The obvious outlier is the Carson-Sanders match-up. This is probably an artifact of the fact that only one poll made it through our filters, so the point estimate is probably unreliable.
On average, there is little difference between the performance of the two Democrat candidates. The Republican candidates are ordered in the table in order of increasing strength. Trump has the best average performance against the Democrat field. In turn, Clinton has a better chance of beating Trump than does Sanders. See the chart below.

A linear model of the above data suggests that Trump is the strongest Republican presidential candidate, while there is not much substantial difference between the Democrat candidates; see below.

 RSS Feed