Lattice Insight, LLC
​Mathematical Statistics Consulting
Follow/Contact
  • Home
  • About
  • Projects
  • Contact
  • Blog

From data to decisions

Let a professional mathematician and statistician help you make evidence-based decisions.

Download our presentation

Measuring GDP change: are we in a recession?

5/31/2015

0 Comments

 
Picture
How do we know whether we're really economically miserable? The official definition of a recession is two or more consecutive quarters of negative GDP growth. As long as GDP grows by even one dollar during the quarter, that interrupts any recession that might be taking place - officially speaking.

However, reality is more complex. That one dollar growth in production does nothing to improve the well-being of people if prices and/or population have risen during that quarter - and usually they both do increase. A 0.1% increase in your income is a decrease in practical terms if prices have risen by 1%, or if that income is shared by more people.

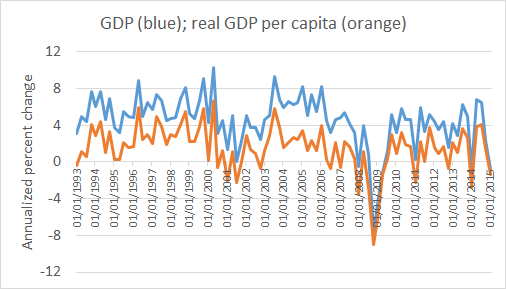
The graph above shows data downloaded from FRED, the research arm of the St. Louis Federal Reserve Bank. The blue curve is the annualized percent change in raw GDP - the official number, reported by the media. The orange curve is the much more important number, adjusted for price increases and population increases. According to the orange curve, the 2008-2009 recession was four quarters long, not three. 2011Q1 and 2012Q4 were contractions as well according to the orange curve.

As far as we know at this time, we are not yet in a recession. The second quarter will shed more light on this question.
0 Comments

Plotting positions

5/18/2015

0 Comments

 
Suppose you drew a random sample from a population. How large could we expect the sample's minimum and maximum to be? Obviously, the sample's minimum and maximum would change every time we drew the sample, but if we drew samples repeatedly, we might expect to see predictable patterns.

In fact, this is the case, and the minimum and maximum are just the two extreme members of the order statistics. The median is also a well-known order statistic, when the sample has odd size. The distributions of all order statistics are known.

If we wanted to determine whether a sample is likely to have been drawn from a normal distribution, for example, we might compare the numbers that were actually observed to the expected values of the order statistics. Too large a departure, and we might suspect that the observations are unlikely to have been drawn from a normal distribution.

This question is often judged by examining a Q-Q (quantile-quantile) plot, or less frequently a P-P (probability-probability) plot. These in turn depend on judgments as to where the order statistics should be plotted. This issue is the unsettled question of plotting positions. There are several plausible formulas for plotting positions that are commonly used. Most have the form Phiinv[(k-a)/(n+1-2a)], where 0<=a<1, k is the index of interest, n is the sample size, and Phiinv is the probit function, the quantile function for the standard normal distribution (and inverse to the cdf of the standard normal). There are strong arguments in favor of a=0 and a=1/2.

A popular estimate (Blom, 1958) of the order statistics of a sample from a normal population makes use of a=3/8. But it turns out this is a somewhat sloppy approximation of the accurate estimate (Elfving, 1947) in which a=pi/8. The approximation depends on the belief that 3 is sufficiently close to pi!

I discussed this question in a post on StatsExchange. Read the original question and the answers here:
http://stats.stackexchange.com/questions/9001/approximate-order-statistics-for-normal-random-variables/152834#152834
0 Comments

Choosing the number of clusters for a cluster analysis

5/13/2015

0 Comments

 
Picture
It's the question without an obvious answer in cluster analysis: into how many clusters should we group our data? You are lucky if the data groups into a small number of visible, compact clusters that are clearly distinct from one another. Usually the choice is ambiguous, often depending on the clustering method used.

I am a big fan of Ward's method of clustering. The dendrograms associated with Ward's method lend themselves to fairly obvious recommendations for the number of clusters, because the higher branches tend to be the longest, especially in comparison to dendrograms arising from other agglomerative hierarchical clustering methods. (In technical terms, dendrograms arising from Ward's method tend to have larger agglomerative coefficients, closer to 1, compared with complete linkage [2nd best], average linkage [3rd best], and single linkage [the worst].)

The Calinski-Harabasz pseudo-F statistic tries to explain the most variation between clusters using the fewest clusters, employing a formula that suspiciously resembles an F-statistic. When the data is multivariate normal and the clustering method is Ward's, the pseudo-F statistic is in fact an F-statistic!

Typically we try to maximize the pseudo-F statistic. For one dataset I studied recently, the maximum occurred at k = 5 clusters, as shown in the graph above, with k = 8 a close second. The dendrogram reveals that 5 clusters and 8 clusters are natural choices for this data.

But when the pseudo-F statistic is in fact an F-statistic, an alternative is to determine the p-value for the F-values above, and choose the number of clusters that minimizes p, giving us the most significant value of k. In the graph below, the partitioning of variance among 8 clusters is more significant than among 5 clusters. (Horizontal lines on this graph of log p show the location of p = .05 [upper] and p = .01 [lower].)
Picture
0 Comments

    Author

    Hal M. Switkay, Ph.D. is a professional mathematician and statistician.

    Archives

    December 2020
    September 2020
    August 2020
    July 2020
    May 2020
    April 2020
    September 2019
    August 2019
    May 2019
    December 2018
    January 2017
    October 2016
    August 2016
    June 2016
    April 2016
    March 2016
    February 2016
    January 2016
    December 2015
    October 2015
    September 2015
    July 2015
    June 2015
    May 2015
    April 2015
    March 2015
    February 2015
    January 2015

    Categories

    All

    RSS Feed

Web Hosting by MyDomain
Website contents copyright Lattice Insight, LLC, 2015. All rights reserved.