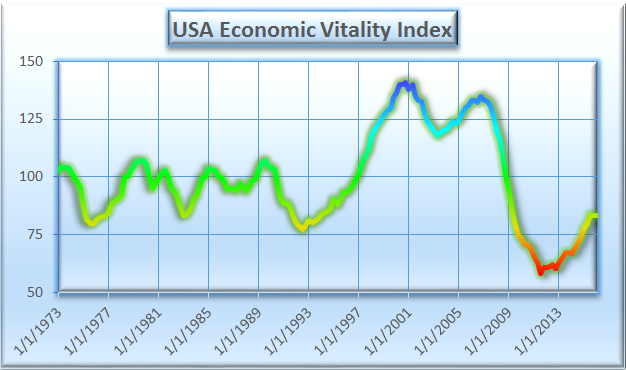
The Switkay USA Economic Vitality Index decreased 0.18 points to reach a level of 83.26 for the 1st quarter of 2016, its second consecutive decline.
The U6 underemployment rate fell from 9.9% in the 4th quarter to 9.8% in the 1st quarter. However, concern remains over the unusually high U6/U3 ratio, reflecting a higher usage of part-time workers than previously; the fact that Gallup's survey of underemployment reports numbers about 4% higher than the Labor Department's; the labor force participation rate of 62.9%, hovering near 38-year lows; and mean weeks of unemployment is up by 1 week to 28.8
The velocity of the M2 money supply slipped about 1.6% in the 1st quarter to 1.459, a new record low in the 42+ year history of this dataset; this is an ominous sign for the economy.
The debt-to-GDP ratio increased 1.5%, to a new level of 105.7%, surpassing the previous high in the 1st quarter of 2014.
This is the first period of back-to-back declines for the index since mid-2011. If we ignore one-quarter changes of direction as statistical noise, we can characterize:
The Switkay USA Economic Vitality Index is a function of the following variables:
· real gross domestic product per capita;
· total Federal debt as a percentage of gross domestic product;
· the U6 unemployment rate (including those working part-time who would prefer full-time work);
· mean weeks of unemployment;
· average hourly earnings, production and non-supervisory employees, private;
· US population;
· the civilian labor force participation rate;
· the consumer price index, all urban consumers;
· the velocity of the M2 money stock;
· the real trade-weighted exchange value of the US dollar (broad index);
· real net worth of households and non-profits.
It is updated at the end of every quarter, when data for the previous quarter become finalized. We use the word real to mean inflation-adjusted. All data is taken from FRED, the research service of the Federal Reserve Bank of St. Louis. The index is normalized so that its median value in the years 1973 to 2008 is 100.
The U6 underemployment rate fell from 9.9% in the 4th quarter to 9.8% in the 1st quarter. However, concern remains over the unusually high U6/U3 ratio, reflecting a higher usage of part-time workers than previously; the fact that Gallup's survey of underemployment reports numbers about 4% higher than the Labor Department's; the labor force participation rate of 62.9%, hovering near 38-year lows; and mean weeks of unemployment is up by 1 week to 28.8
The velocity of the M2 money supply slipped about 1.6% in the 1st quarter to 1.459, a new record low in the 42+ year history of this dataset; this is an ominous sign for the economy.
The debt-to-GDP ratio increased 1.5%, to a new level of 105.7%, surpassing the previous high in the 1st quarter of 2014.
This is the first period of back-to-back declines for the index since mid-2011. If we ignore one-quarter changes of direction as statistical noise, we can characterize:
- 1989Q3 to 1992Q2 as contraction;
- 1992Q3 to 2000Q2 as expansion;
- 2000Q3 to 2003Q2 as contraction;
- 2003Q3 to 2006Q1 as expansion;
- 2006Q2 to 2011Q3 as contraction;
- 2011Q4 to 2015Q3 as expansion;
- 2015Q4 to present as contraction.
The Switkay USA Economic Vitality Index is a function of the following variables:
· real gross domestic product per capita;
· total Federal debt as a percentage of gross domestic product;
· the U6 unemployment rate (including those working part-time who would prefer full-time work);
· mean weeks of unemployment;
· average hourly earnings, production and non-supervisory employees, private;
· US population;
· the civilian labor force participation rate;
· the consumer price index, all urban consumers;
· the velocity of the M2 money stock;
· the real trade-weighted exchange value of the US dollar (broad index);
· real net worth of households and non-profits.
It is updated at the end of every quarter, when data for the previous quarter become finalized. We use the word real to mean inflation-adjusted. All data is taken from FRED, the research service of the Federal Reserve Bank of St. Louis. The index is normalized so that its median value in the years 1973 to 2008 is 100.
 RSS Feed