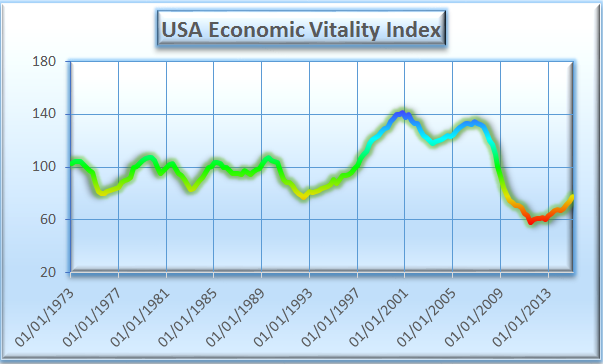
The Switkay USA Economic Vitality Index increased 4.35 points to reach a level of 78.01 for the 1st quarter of 2015, the highest level of the index since the 3rd quarter of 2009. This came despite a decrease in real GDP per capita of 0.8%. In addition, M2 velocity was at its lowest recorded level of 1.500.
Two factors improved notably during the 1st quarter. The trade-weighted value of the dollar rose nearly 5%, perhaps due to quantitative easing in Europe. Also, mean household net worth increased a bit more than 2%.
The Switkay USA Economic Vitality Index is a function of the following variables:
· real gross domestic product per capita;
· total Federal debt as a percentage of gross domestic product;
· the U6 unemployment rate (including those working part-time who would prefer full-time work);
· mean weeks of unemployment;
· average hourly earnings, production and non-supervisory employees, private;
· US population;
· the civilian labor force participation rate;
· the consumer price index, all urban consumers;
· the velocity of the M2 money stock;
· the real trade-weighted exchange value of the US dollar (broad index);
· real net worth of households and non-profits.
It is updated at the end of every quarter, when data for the previous quarter become finalized. We use the word real to mean inflation-adjusted. All data is taken from FRED, the research service of the Federal Reserve Bank of St. Louis. The index is normalized so that its median value in the years 1973 to 2008 is 100.
 RSS Feed