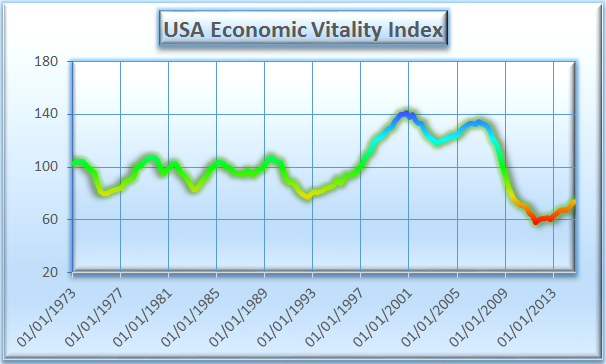
The Switkay USA Economic Vitality Index for 2014, 4th quarter is 73.66. This represents an increase of 2.29 from the previous quarter. The index is continuing to rebound slowly from its recession low of 58.21 in 2011, 3rd quarter. The index now stands at its highest level since 2009, 3rd quarter.
The Switkay USA Economic Vitality Index is a function of the following variables:
· real gross domestic product per capita;
· total Federal debt as a percentage of gross domestic product;
· the U6 unemployment rate (including those working part-time who would prefer full-time work);
· mean weeks of unemployment;
· average hourly earnings, production and non-supervisory employees, private;
· US population;
· the civilian labor force participation rate;
· the consumer price index, all urban consumers;
· the velocity of the M2 money stock;
· the real trade-weighted exchange value of the US dollar (broad index);
· real net worth of households and non-profits.
It is updated at the end of every quarter, when data for the previous quarter become finalized. We use the word real to mean inflation-adjusted. All data is taken from FRED, the research service of the Federal Reserve Bank of St. Louis. The index is normalized so that its median value in the years 1973 to 2008 is 100.
The change in the index's value for the 4th quarter of 2014 was driven most strongly by a 4% increase in the real trade-weighted exchange value of the US dollar (broad index). This could be due to an anticipation of a rate increase by the Federal Reserve Bank, or by quantitative easing in Europe, among other reasons.
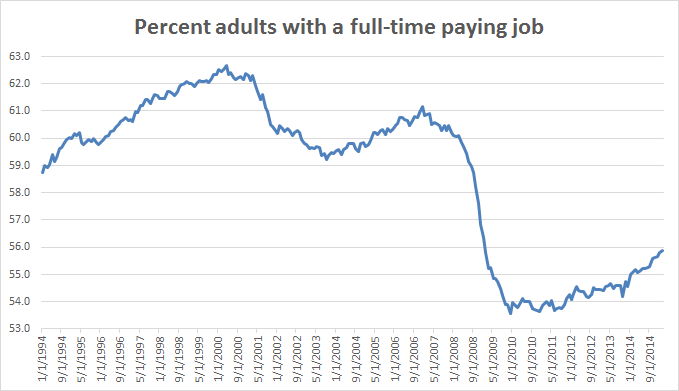
The U6 unemployment rate declined slightly for the quarter, but the labor force participation rate was unchanged, near 37-year lows, and mean weeks of unemployment increased for the first time in more than a year.
The Switkay USA Economic Vitality Index is a function of the following variables:
· real gross domestic product per capita;
· total Federal debt as a percentage of gross domestic product;
· the U6 unemployment rate (including those working part-time who would prefer full-time work);
· mean weeks of unemployment;
· average hourly earnings, production and non-supervisory employees, private;
· US population;
· the civilian labor force participation rate;
· the consumer price index, all urban consumers;
· the velocity of the M2 money stock;
· the real trade-weighted exchange value of the US dollar (broad index);
· real net worth of households and non-profits.
It is updated at the end of every quarter, when data for the previous quarter become finalized. We use the word real to mean inflation-adjusted. All data is taken from FRED, the research service of the Federal Reserve Bank of St. Louis. The index is normalized so that its median value in the years 1973 to 2008 is 100.
The change in the index's value for the 4th quarter of 2014 was driven most strongly by a 4% increase in the real trade-weighted exchange value of the US dollar (broad index). This could be due to an anticipation of a rate increase by the Federal Reserve Bank, or by quantitative easing in Europe, among other reasons.
The U6 unemployment rate declined slightly for the quarter, but the labor force participation rate was unchanged, near 37-year lows, and mean weeks of unemployment increased for the first time in more than a year.

 RSS Feed