Lattice Insight, LLC
​Mathematical Statistics Consulting
Follow/Contact
  • Home
  • About
  • Projects
  • Contact
  • Blog

From data to decisions

Let a professional mathematician and statistician help you make evidence-based decisions.

Download our presentation

The Switkay Freedom and Development Index, 2015

2/18/2015

0 Comments

 
Picture
This index provides an overview of quality of life in 123 countries so far (more to be added time permitting). It combines information from the following public sources:
25% is the Freedom in the World index published by Freedom House, of which 40% is political rights and 60% is civil liberties;
25% is the Index of Economic Freedom published by the Heritage Foundation and the Wall Street Journal;
50% is the Human Development Index published by the United Nations, which comprises life expectancy, average years of education, and per capita income (purchasing power parity).

Australia and New Zealand have the highest scores, and are the only countries to score over 90 on a scale of 0-100. The United States of America scores 87.51, China 37.61, and India 51.44.

Update: 15 more countries have been added, for a total of 138. This will be the final version, absent any special requests.
0 Comments

Return on investment by asset class

2/15/2015

0 Comments

 
Picture
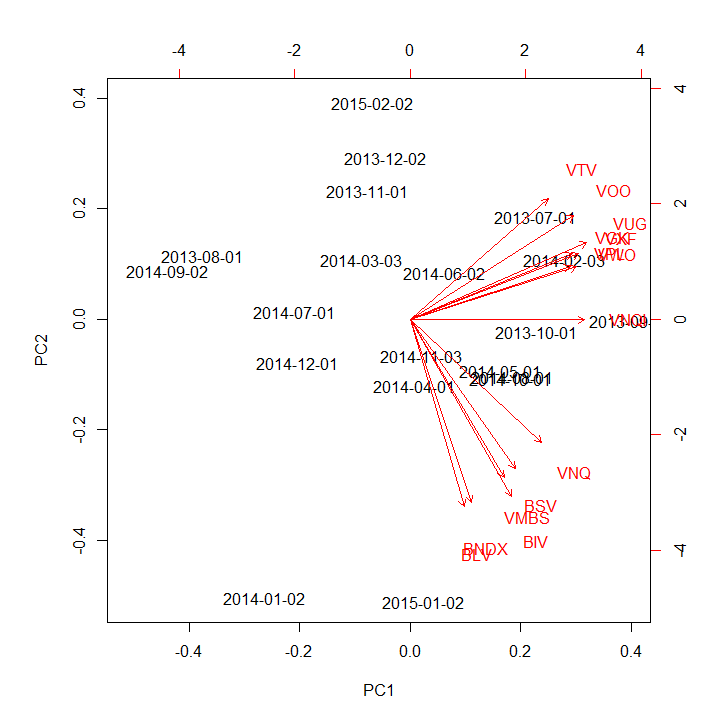
This represents the result of a very preliminary study of return on investment by asset class. The time period includes the complete months from June, 2013 to January, 2015. Vanguard index ETFs were used as proxies for 14 asset classes. Two dimensions accounted for about 4/5 of the variation in the dataset. This is reinforced by the fact that the lengths of the vectors in the diagram above are roughly similar.

We observe that the various stock classes are highly correlated with one another; the same is true of the various bond classes. The two real-estate classes show a bit of independence from both stocks and bonds.

This is not to say that improvement in risk-adjusted return is impossible with a more careful allocation. Indeed, a more detailed study, including sectoral funds and inverse (short) funds, suggests one can achieve a higher Sharpe ratio with an appropriate allocation than any of the components.
0 Comments

Language by GDP

2/9/2015

0 Comments

 
Picture
This image represents a breakdown of world GDP by language, using purchasing power parity (PPP) rather than nominal (exchange-rate) GDP. PPP GDP better reflects the cost of living in each country, and allows more significance for countries with larger populations but less-developed standards of living. It may also be a guide to the dominant languages of the future.

English represents 24.8% of the total; Chinese 17.2%; Spanish 6.6%; Hindi 5.7%; Japanese 5.4%; German 4.5%. This sum is a total taken only across the 30 countries with the largest GDP (PPP). With more countries included, it is likely that the total would rise for English, Spanish, French, and Arabic, as these four are the official languages in more countries than any other language.
0 Comments

Unemployment and underemployment in America

2/6/2015

0 Comments

 
Picture
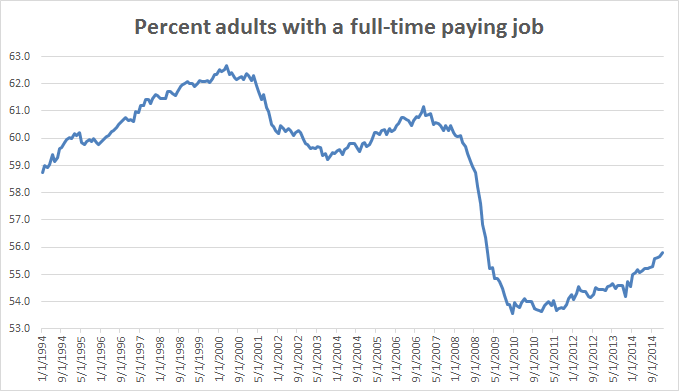
There has been a lot of animated discussion about the meaning of the monthly report from the US Bureau of Labor Statistics. I find it useful to combine 1) the labor force participation rate (measuring the fraction of adults who are working or looking for work), with 2) the U6 unemployment rate, which counts not only the unemployed in the more widely quoted U3 rate, but also long-term unemployed and those working part-time who would prefer full-time work. This combination tells us what fraction of the adult population has full-time work.

The image above covers the period January, 1994 to December, 2014. The high point is 62.7% in April, 2000. The low point is 53.6% in December, 2009 and December, 2010. The current level is 55.8%, the highest since February, 2009.

Update: at the current rate of growth, the percent of adults with a full-time paying job will reach its former peak sometime in 2028.
0 Comments

Unemployment rate by state, December, 2014

2/4/2015

0 Comments

 
Picture
U3 unemployment rate by state, December, 2014
Here is the U3 unemployment report for December, 2014, by state and metro area:
_
The lowest unemployment rate is 2.8% in North Dakota; the highest is 7.2% in Washington, DC. (The map doesn't show Puerto Rico, with its 12.1% unemployment rate.) All rates are U3 unemployment, ignoring long-term discouraged unemployed and part-time workers who would prefer to be working full-time, who are counted in the U6 rate. Currently, the U6 rate is approximately double the U3 rate.
0 Comments

Super Bowl 49

2/1/2015

0 Comments

 
Who is likely to win today's Super Bowl? I ran two very simple models to find out. Both were based on the number of points for (PF) and points against (PA) during the regular season plus the playoffs. Both models predict a win by the New England Patriots over the Seattle Seahawks.

The first model is very cautious, giving New England a 51% probability of victory. The second model is less cautious, giving an 81% probability of a win to New England, as well as a predicted margin of victory of 2 points. We shall see later today. Play ball!

Update, the morning after: I ran a third model, again predicting a margin of victory of 2 points. However, this model concludes that the probability of a New England victory is 54%. This model seems the most sound, as it is based on only the two teams' records during the season, as opposed to the second model, which relied on the records of all the teams in the league. It seems to be borne out by the closeness of the game.

Yet another reminder that statistics works best with large sample sizes. When n = 1, you are taking a big chance!
0 Comments

    Author

    Hal M. Switkay, Ph.D. is a professional mathematician and statistician.

    Archives

    December 2020
    September 2020
    August 2020
    July 2020
    May 2020
    April 2020
    September 2019
    August 2019
    May 2019
    December 2018
    January 2017
    October 2016
    August 2016
    June 2016
    April 2016
    March 2016
    February 2016
    January 2016
    December 2015
    October 2015
    September 2015
    July 2015
    June 2015
    May 2015
    April 2015
    March 2015
    February 2015
    January 2015

    Categories

    All

    RSS Feed

Web Hosting by MyDomain
Website contents copyright Lattice Insight, LLC, 2015. All rights reserved.