There has been a lot of animated discussion about the meaning of the monthly report from the US Bureau of Labor Statistics. I find it useful to combine 1) the labor force participation rate (measuring the fraction of adults who are working or looking for work), with 2) the U6 unemployment rate, which counts not only the unemployed in the more widely quoted U3 rate, but also long-term unemployed and those working part-time who would prefer full-time work. This combination tells us what fraction of the adult population has full-time work.
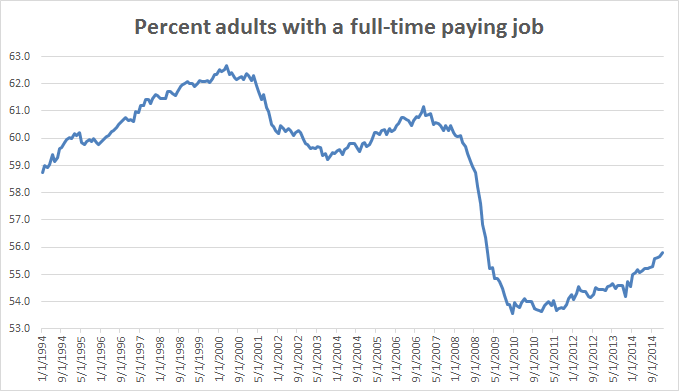
The image above covers the period January, 1994 to December, 2014. The high point is 62.7% in April, 2000. The low point is 53.6% in December, 2009 and December, 2010. The current level is 55.8%, the highest since February, 2009.
Update: at the current rate of growth, the percent of adults with a full-time paying job will reach its former peak sometime in 2028.
 RSS Feed