As campaign season gets underway, inquiring minds want to know: does partisan control in Washington, DC have an effect on economic performance? This question has been asked before, using varied sets of variables, and the answers have varied accordingly. Lattice Insight has been publishing the Switkay USA Economic Vitality Index at the end of every quarter, when finalized data becomes available for the previous quarter. The components making up the index can be tracked back to the beginning of 1973, but they are not all available any earlier.
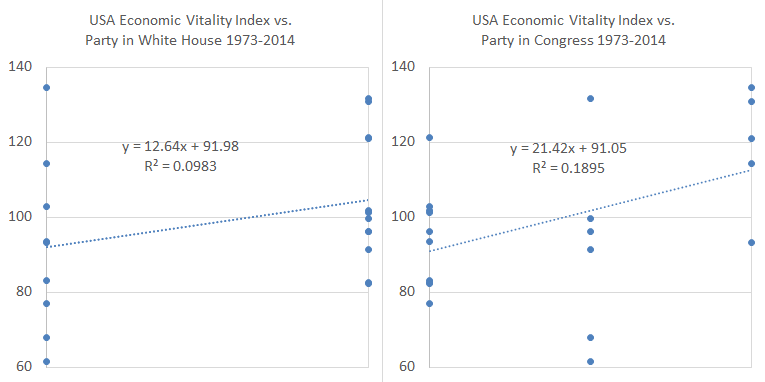
Partisan control in Washington falls naturally into 2-year time blocks: odd-numbered years followed by even-numbered years constitute one congress, between successive congressional elections. From 1973 to 2014 we have 21 such 2-year periods. In each, the White House was controlled by one of the two main political parties. Congress was controlled by one of the parties, or else control of the two houses was split. (The analysis could be refined further by examining the effect of partisan control of each house; however, control of the Senate and of the House have a moderate positive correlation, and there were too few cases of split control to justify such a division.)
The graphs above show the average performance of the Switkay USA Economic Vitality Index as a function of partisan control of the White House and of the Congress for each of the 21 2-year periods, with Democrat control on the left side of the graph and Republican control on the right side. Republican control of each branch appears to produce a positive effect on the index, and this effect is more pronounced for Congress than for the White House.
In a model including both White House and Congress, control of the White House is almost but not quite significant (p = .0668) in the presence of congressional control; control of Congress remains significant (p = .0223) even in the presence of control of the White House. Thus, as the graphs above suggest, control of Congress has more impact on the economy than control of the White House. The model including these two predictors has an R-squared of .3309, meaning partisan control can explain about 33% of the variability of the economic index. Contrary to popular opinion, there is no significant effect with divided control (p = .8831), in which it has been suggested that the economy benefits from having one party in the White House and another controlling Congress.
The 21 2-year periods are divided into 6 categories, based on control of the White House (D or R) and control of Congress (D, split, or R). The best average value for the index was 125.84, under a Republican president and a Republican Congress (2003-2006). The worst average value for the index was 64.74, under a Democrat president and split Congress (2011-2014).
 RSS Feed