Last night, I saw political scientist Helmut Norpoth on television speaking about his model to predict the USA presidential election for 2016. He uses a time series model to predict the popular vote margin for one party over the other. From 1952 until the present, most of the time, the White House has been held for exactly two consecutive terms by each party. Reconstructing his model on my computer, it appears to give Trump a 5.7% advantage over Clinton.
I describe his perspective as a technical analysis, while mine is a fundamental analysis, in the language of investors. Which does a better job? We would prefer a model with higher predictive power and smaller errors, yet employing as few predictor variables as possible.
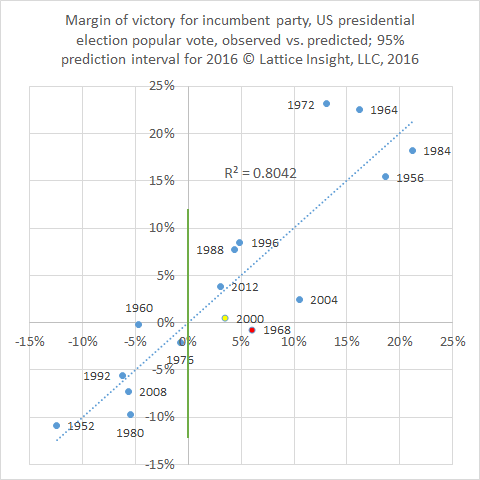
It turns out that the economic model performs better by both standards than the time series model. Also, when both the economic and lagged observation variables are placed together into a large model, the economic variables remain highly significant, while the lagged observation variables are not significant.
Still, we can make use of Norpoth's observation regarding the cyclical nature of White House control in a better way. We introduce a new variable, the number of terms that the incumbent party has held the presidency. This variable remains significant even in the presence of the economic variables.
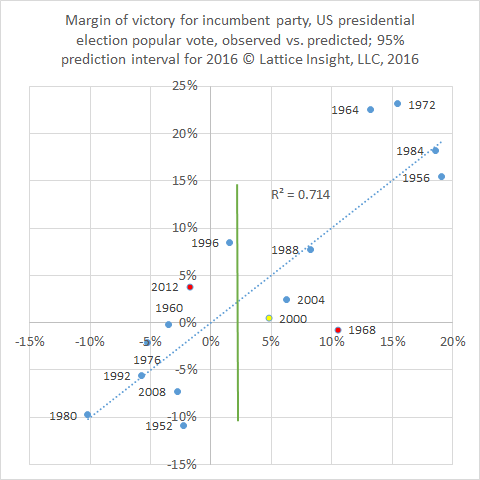
Our previous model (see our most recent blog below) had R-squared = 71.4%; the new model, shown above, boosts R-squared to 80.4%. Indeed, the new model now predicts 15 of the last 16 presidential elections correctly, the exception being 1968, a year of turmoil in America and around the world - and a year not unlike 2016.
The model predicts a margin of 0 in the popular vote between Clinton and Trump - almost even. However, the margin of error is plus or minus about 11.8%. Although this is moderately more precise than the previous model, it still leaves us 95% certain that either Clinton will win by up to 11.8% over Trump, or Trump will win by up to 11.8% over Clinton.
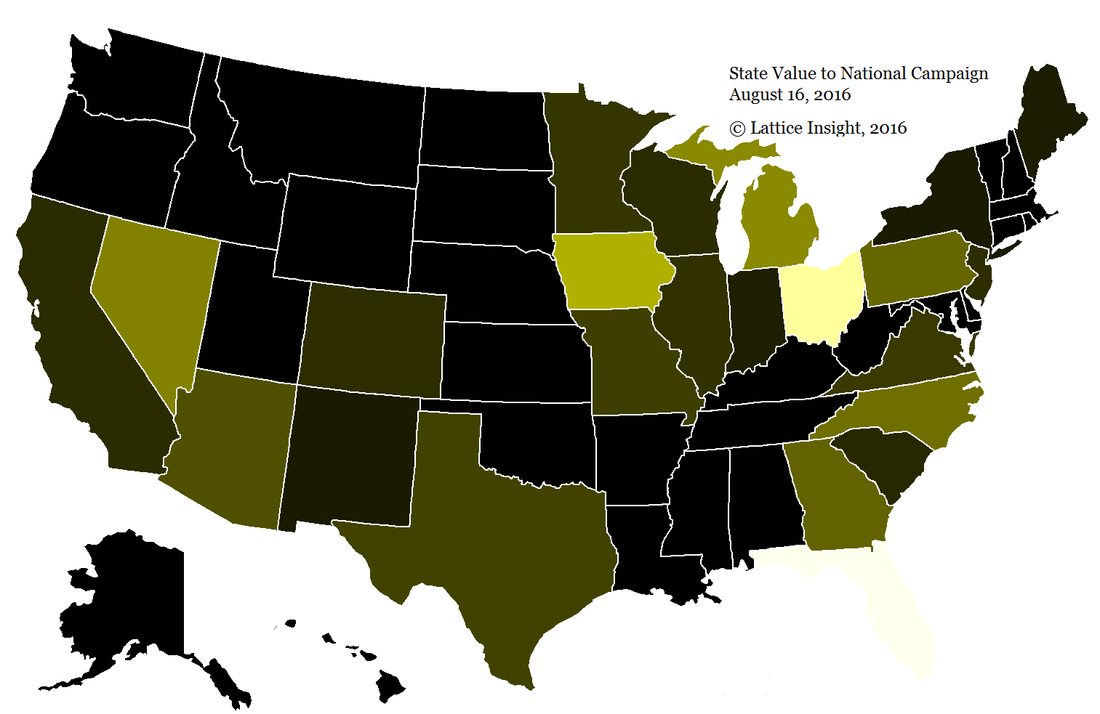
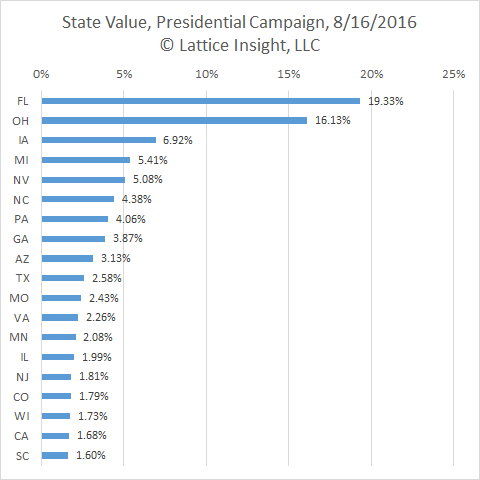
This makes winning the Electoral College more critical than ever. The map below depicts the relative values of the states to the national campaigns, based on 1) number of electoral votes; 2) current poll numbers; 3) presidential voting history; and 4) current political representation. The more brightly colored states are more critical, with Florida and Ohio both as must-win states.
I describe his perspective as a technical analysis, while mine is a fundamental analysis, in the language of investors. Which does a better job? We would prefer a model with higher predictive power and smaller errors, yet employing as few predictor variables as possible.
It turns out that the economic model performs better by both standards than the time series model. Also, when both the economic and lagged observation variables are placed together into a large model, the economic variables remain highly significant, while the lagged observation variables are not significant.
Still, we can make use of Norpoth's observation regarding the cyclical nature of White House control in a better way. We introduce a new variable, the number of terms that the incumbent party has held the presidency. This variable remains significant even in the presence of the economic variables.
Our previous model (see our most recent blog below) had R-squared = 71.4%; the new model, shown above, boosts R-squared to 80.4%. Indeed, the new model now predicts 15 of the last 16 presidential elections correctly, the exception being 1968, a year of turmoil in America and around the world - and a year not unlike 2016.
The model predicts a margin of 0 in the popular vote between Clinton and Trump - almost even. However, the margin of error is plus or minus about 11.8%. Although this is moderately more precise than the previous model, it still leaves us 95% certain that either Clinton will win by up to 11.8% over Trump, or Trump will win by up to 11.8% over Clinton.
This makes winning the Electoral College more critical than ever. The map below depicts the relative values of the states to the national campaigns, based on 1) number of electoral votes; 2) current poll numbers; 3) presidential voting history; and 4) current political representation. The more brightly colored states are more critical, with Florida and Ohio both as must-win states.
 RSS Feed