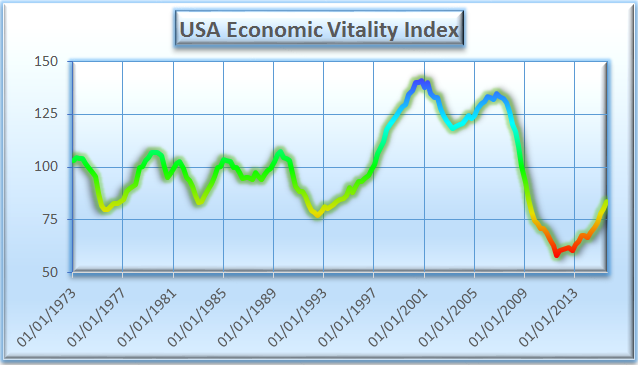
The Switkay USA Economic Vitality Index increased 3.30 points to reach a level of 83.65 for the 3rd quarter of 2015, its highest level since the 2nd quarter of 2009.
One of the big drivers of the index in the 3rd quarter was an upward spike in the trade-weighted value of the US dollar of about 3.5%. This may have reflected an anticipation of an increase in interest rates by the Federal Reserve Bank, something that did finally occur in December.
Further, the U6 underemployment rate fell significantly, from 10.7% in the 2nd quarter to 10.2% in the 3rd quarter. However, concern remains over the unusually high U6/U3 ratio, reflecting a higher usage of part-time workers than previously; the fact that Gallup's survey of underemployment reports numbers more than 4% higher than the Labor Department's; and the labor force participation rate of 62.5%, the lowest level since the 3rd quarter of 1977.
The velocity of the M2 money supply is 1.490, the lowest level in the 42+ year history of this dataset; this is an ominous sign for the economy.
The Switkay USA Economic Vitality Index is a function of the following variables:
· real gross domestic product per capita;
· total Federal debt as a percentage of gross domestic product;
· the U6 unemployment rate (including those working part-time who would prefer full-time work);
· mean weeks of unemployment;
· average hourly earnings, production and non-supervisory employees, private;
· US population;
· the civilian labor force participation rate;
· the consumer price index, all urban consumers;
· the velocity of the M2 money stock;
· the real trade-weighted exchange value of the US dollar (broad index);
· real net worth of households and non-profits.
It is updated at the end of every quarter, when data for the previous quarter become finalized. We use the word real to mean inflation-adjusted. All data is taken from FRED, the research service of the Federal Reserve Bank of St. Louis. The index is normalized so that its median value in the years 1973 to 2008 is 100.
 RSS Feed