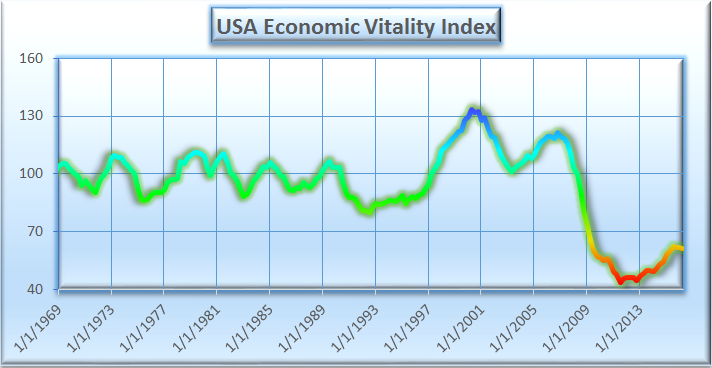
Our USA Economic Vitality Index has undergone two improvements. First, the data series has been extended back to 1966Q1; our graph begins in 1969Q1, in order to group it by presidential administrations. Second, we have added two important components to the index: total consumer debt as a fraction of GDP, and the employment-population ratio for men, which is an important social indicator.
Our new version of the index currently stands at 61.32 as of 2016Q2, a decline of 0.29 points from the first quarter. This is the third consecutive decline, confirming that the US economy is in a contraction by the standards of this index. The previous high, 62.36 in 2015Q3, was the highest level since 2009Q2.
Of ongoing concern is the continuing decline of the velocity of M2 money, the ratio of GDP to the M2 money supply. This ratio currently stands at a new record low of 1.450, the lowest in the history of this data series.
The labor force participation rate stands near 38-year lows. Mean weeks of unemployment still stands above 27 weeks. The employment-population ratio for men has not yet recovered to its level at the end of 2008. Federal debt stands at 105% of GDP, close to the recent post World War 2 record.
The Switkay USA Economic Vitality Index is a function of the following variables:
It is updated at the end of every quarter, when data for the previous quarter become finalized. We use the word real to mean inflation-adjusted. All data is taken from FRED, the research service of the Federal Reserve Bank of St. Louis. The index is normalized so that its median value in the years 1969 to 2008 is 100.
Excepting reverses of only one quarter, the index indicates:
Our new version of the index currently stands at 61.32 as of 2016Q2, a decline of 0.29 points from the first quarter. This is the third consecutive decline, confirming that the US economy is in a contraction by the standards of this index. The previous high, 62.36 in 2015Q3, was the highest level since 2009Q2.
Of ongoing concern is the continuing decline of the velocity of M2 money, the ratio of GDP to the M2 money supply. This ratio currently stands at a new record low of 1.450, the lowest in the history of this data series.
The labor force participation rate stands near 38-year lows. Mean weeks of unemployment still stands above 27 weeks. The employment-population ratio for men has not yet recovered to its level at the end of 2008. Federal debt stands at 105% of GDP, close to the recent post World War 2 record.
The Switkay USA Economic Vitality Index is a function of the following variables:
- real gross domestic product per capita;
- total Federal debt as a percentage of gross domestic product;
- the U6 unemployment rate (including those working part-time who would prefer full-time work);
- mean weeks of unemployment;
- average hourly earnings, production and non-supervisory employees, private;
- US population;
- the civilian labor force participation rate;
- the employment-population ratio for men;
- the consumer price index, all urban consumers;
- the velocity of the M2 money stock;
- the real trade-weighted exchange value of the US dollar (broad index);
- real net worth of households and non-profits
- total consumer credit as a percentage of gross domestic product.
It is updated at the end of every quarter, when data for the previous quarter become finalized. We use the word real to mean inflation-adjusted. All data is taken from FRED, the research service of the Federal Reserve Bank of St. Louis. The index is normalized so that its median value in the years 1969 to 2008 is 100.
Excepting reverses of only one quarter, the index indicates:
- expansion, 1966 (earliest data) to 1969Q3;
- contraction, 1969Q4 to 1971Q4;
- expansion, 1972Q1 to 1973Q2;
- contraction, 1973Q3 to 1975Q3;
- expansion, 1975Q4 to 1979Q2;
- contraction, 1979Q3 to 1980Q3;
- expansion, 1980Q4 to 1981Q3;
- contraction, 1981Q4 to 1983Q1;
- expansion, 1983Q2 to 1985Q1;
- contraction, 1985Q2 to 1988Q1;
- expansion, 1988Q2 to 1989Q3;
- contraction, 1989Q4 to 1992Q3;
- expansion, 1992Q4 to 2000Q2;
- contraction, 2000Q3 to 2003Q2;
- expansion, 2003Q3 to 2006Q1;
- contraction, 2006Q2 to 2011Q3;
- expansion, 2011Q4 to 2015Q3;
- contraction, 2015Q4 to present.
 RSS Feed