An article on yesterday's Marketwatch website discussed a new ETF under the ticker symbol FRDM. This ETF is marketed by Life + Liberty Indexes, at this website: www.lifeandlibertyindexes.com
The management believes that personal and economic freedom are positively associated with greater opportunities for growth. This is a hypothesis that can be tested.
We employed stock performance data from the IShares website: www.ishares.com/us/products/etf-investments#!type=ishares&style=44342&fac=43511&fsac=43535&view=keyFacts
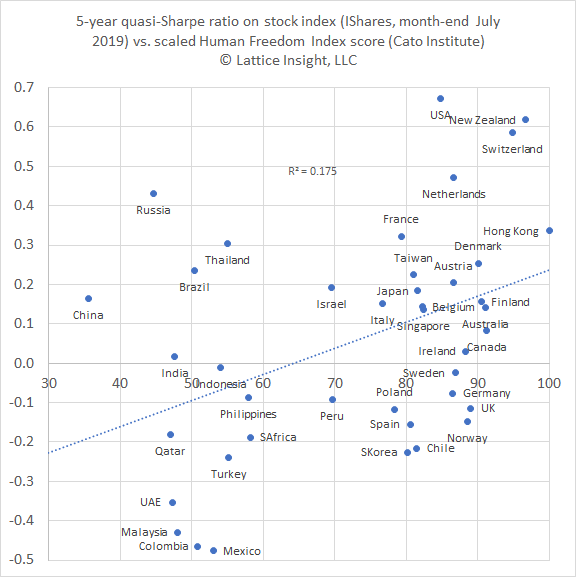
Among the listings are ETFs tracking broad stock market indexes for 41 countries and territories. We took average annual return on NAV for 5, 3, and 1-year periods, together with standard deviations for 3 and 1-year periods available from Fidelity Investments. This was used to construct a quasi-Sharpe ratio for the 41 countries and territories. We did not seek to incorporate 10-year performance data, which was unavailable for many of the countries concerned.
We compared this to the Cato Institute's studies on human freedom www.cato.org/human-freedom-index-new and economic freedom www.cato.org/economic-freedom-world, and their report of the aggregate amount of freedom in these 41 countries and territories, scaled to a sum from 0 to 100.
The result is graphed above. There is a moderate positive association between stock performance and freedom, but R^2 is only 17.5%. The graph depicts some unfree countries substantially outperforming the model, as well as some free countries substantially underperforming the model.
It appears that the freedom variable provides has only weak predictive ability for stock market performance. While it is possible that 10-year data might smooth out irregularities in the business cycle, it seems likely that we need new variables to explain the discrepancies between countries that lie far above the trendline, and those that lie far below the trendline. Suggestions are welcome.
Full disclosure: After viewing the graph above, the author added the New Zealand and Switzerland ETFs to his portfolio, which already included the American stock market.
The management believes that personal and economic freedom are positively associated with greater opportunities for growth. This is a hypothesis that can be tested.
We employed stock performance data from the IShares website: www.ishares.com/us/products/etf-investments#!type=ishares&style=44342&fac=43511&fsac=43535&view=keyFacts
Among the listings are ETFs tracking broad stock market indexes for 41 countries and territories. We took average annual return on NAV for 5, 3, and 1-year periods, together with standard deviations for 3 and 1-year periods available from Fidelity Investments. This was used to construct a quasi-Sharpe ratio for the 41 countries and territories. We did not seek to incorporate 10-year performance data, which was unavailable for many of the countries concerned.
We compared this to the Cato Institute's studies on human freedom www.cato.org/human-freedom-index-new and economic freedom www.cato.org/economic-freedom-world, and their report of the aggregate amount of freedom in these 41 countries and territories, scaled to a sum from 0 to 100.
The result is graphed above. There is a moderate positive association between stock performance and freedom, but R^2 is only 17.5%. The graph depicts some unfree countries substantially outperforming the model, as well as some free countries substantially underperforming the model.
It appears that the freedom variable provides has only weak predictive ability for stock market performance. While it is possible that 10-year data might smooth out irregularities in the business cycle, it seems likely that we need new variables to explain the discrepancies between countries that lie far above the trendline, and those that lie far below the trendline. Suggestions are welcome.
Full disclosure: After viewing the graph above, the author added the New Zealand and Switzerland ETFs to his portfolio, which already included the American stock market.
 RSS Feed