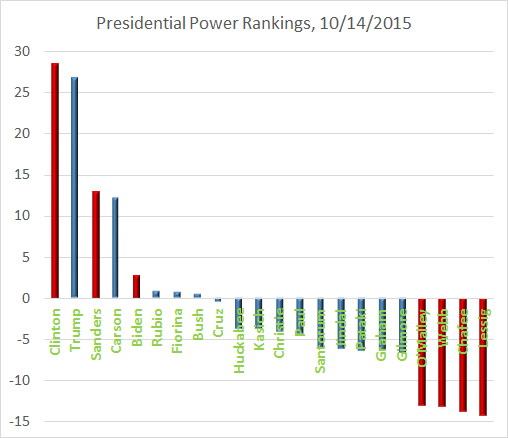
How are the presidential candidates doing in the polls? Here is one way to visualize it. The rankings utilize the latest value of the smoothed average of all polls published on the Huffington Post, a more inclusive average than that published by Real Clear Politics. Each candidate is compared to the average poll share per candidate; this is 14.3% (100%/7) for the Democrats (in red), and 6.7% (100%/15) for the Republicans (in blue).
Since Biden is included in all polls, he is included in the denominator of the above fraction. If Biden is not included, the standard of comparison would be 16.7% (100%/6) for Democrats, dropping each Democrat candidate 2.4%.
Clinton and Trump hold commanding leads for the time being, although Sanders and Carson are surging. See however my previous post on Zipf's law.
The graph suggests that the lowest ranking four Democrat candidates, and the lowest ranking five (or even nine) Republican candidates could be dropped from future debates without disappointing too much of the public. These candidates are supported appreciably less than the average within their respective parties.
 RSS Feed