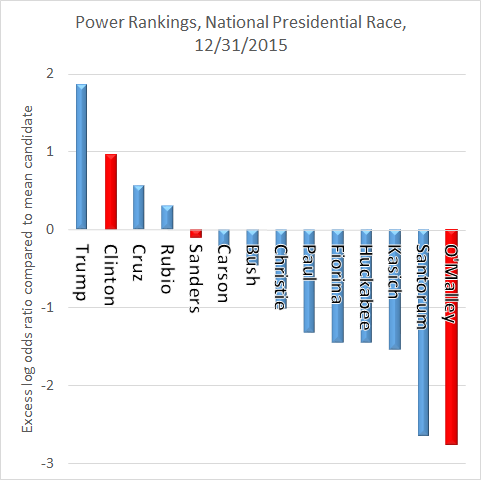
We begin with the candidate power rankings. However, we change the vertical scale compared to last time we discussed the subject; now it measures distance between logits rather than between the raw poll numbers.
Only 4 candidates are above water: Trump, Clinton, Cruz, and Rubio. Sanders, Carson, and Bush are close to break-even. It is hard to consider the other candidates as viable. (Gov. Gilmore is not shown on this graph; he would appear down at negative infinity.)
We consider whether Zipf's law, or some power law, as discussed in an earlier post, could apply to the odds ratios for the candidates in their respective races.
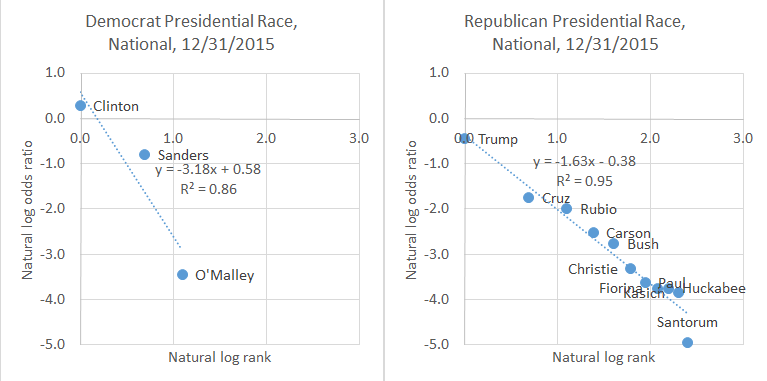
The fit is fairly good in each party, and becomes even better when the trailing candidates (O'Malley, Santorum) are removed.
The expected performance of the leading candidate is given below.
The expected performance of the leading candidate is given below.
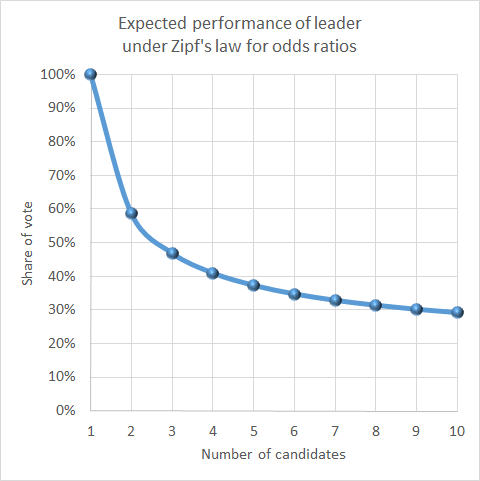
If Zipf's law holds for odds ratios in a 2-person race, the leader should poll about 58.6%. In a 3-person race, it's 46.8%; in a 4-person race, it's 40.9%; and in a 5-person race, it's 37.2%.
Lastly, we analyze the distribution of the 22 national polls in the Republican presidential race conducted entirely during December. We focus only on the 6 top candidates. A biplot is shown below.
Lastly, we analyze the distribution of the 22 national polls in the Republican presidential race conducted entirely during December. We focus only on the 6 top candidates. A biplot is shown below.
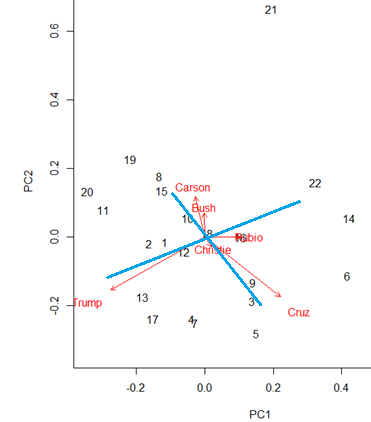
There are several interesting items to observe. One is that Trump is the only candidate who has negative correlations with each of the other 5 (the correlation matrix shows this), suggesting Trump is rather distinctive in the race. Another is the appearance of two axes dominating the picture: a Trump-Rubio axis (outsider vs. establishment?) and a Cruz-Carson axis (choices for social conservatives?). We also can perceive poll 21 as a distinctive outlier.
The Democrat presidential race does not offer much in the way of statistical challenges. It has become essentially a 2-person race, for the moment. If that should change, we will analyze it.
The Democrat presidential race does not offer much in the way of statistical challenges. It has become essentially a 2-person race, for the moment. If that should change, we will analyze it.
 RSS Feed