Everyone wants to know how to pick a winner in the stock market. What should you look for? I analyzed a dataset created by Stephen Jones, of String Advisors, and Chris Mayer, of Agora Financial's Capital and Crisis: http://agorafinancial.com/publication/fst/
Their dataset contained dozens of variables for hundreds of companies over decades of time. That's a lot of data!
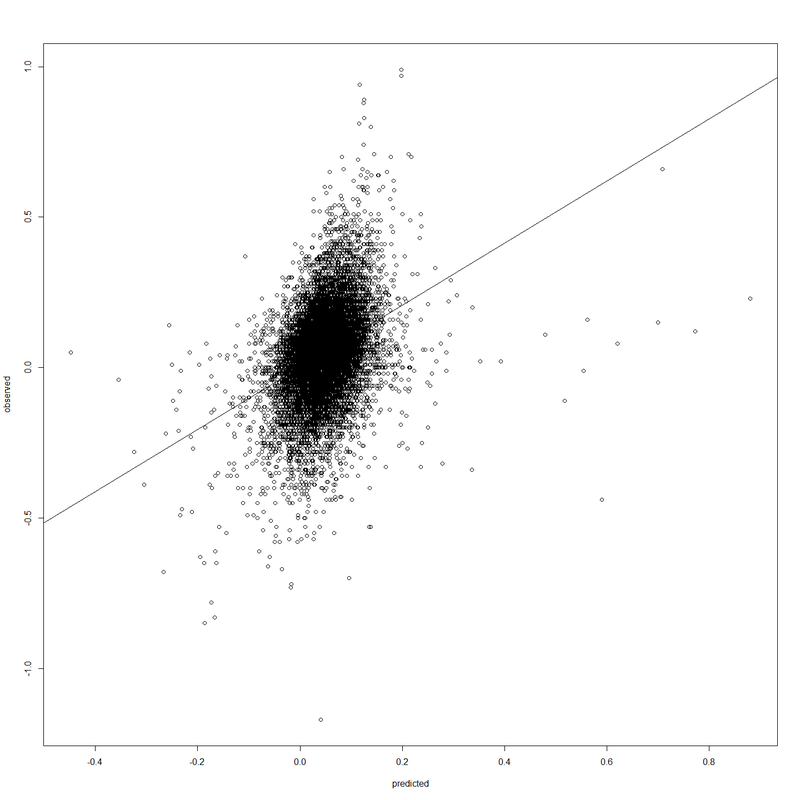
My model suggests you can predict about 12.76% of the variability in the total return of a stock by looking at some of the well-known ratios involving the stock's price - but these ratios play an unexpected role in the formula. Put another way, the correlation between the observed returns and those predicted by my model is about .357, as shown in the image above.
This is only the beginning of a fascinating project. Stay tuned!
Their dataset contained dozens of variables for hundreds of companies over decades of time. That's a lot of data!
My model suggests you can predict about 12.76% of the variability in the total return of a stock by looking at some of the well-known ratios involving the stock's price - but these ratios play an unexpected role in the formula. Put another way, the correlation between the observed returns and those predicted by my model is about .357, as shown in the image above.
This is only the beginning of a fascinating project. Stay tuned!
 RSS Feed