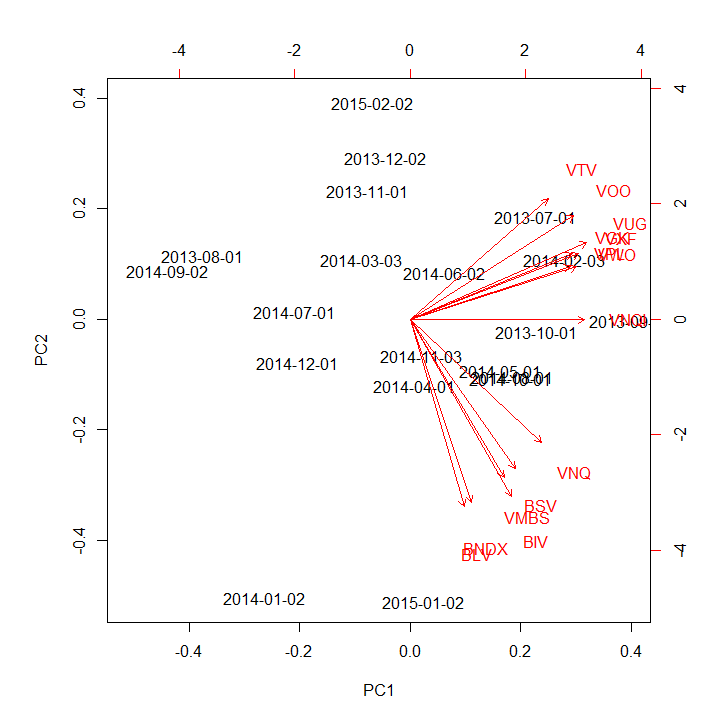
This represents the result of a very preliminary study of return on investment by asset class. The time period includes the complete months from June, 2013 to January, 2015. Vanguard index ETFs were used as proxies for 14 asset classes. Two dimensions accounted for about 4/5 of the variation in the dataset. This is reinforced by the fact that the lengths of the vectors in the diagram above are roughly similar.
We observe that the various stock classes are highly correlated with one another; the same is true of the various bond classes. The two real-estate classes show a bit of independence from both stocks and bonds.
This is not to say that improvement in risk-adjusted return is impossible with a more careful allocation. Indeed, a more detailed study, including sectoral funds and inverse (short) funds, suggests one can achieve a higher Sharpe ratio with an appropriate allocation than any of the components.
 RSS Feed