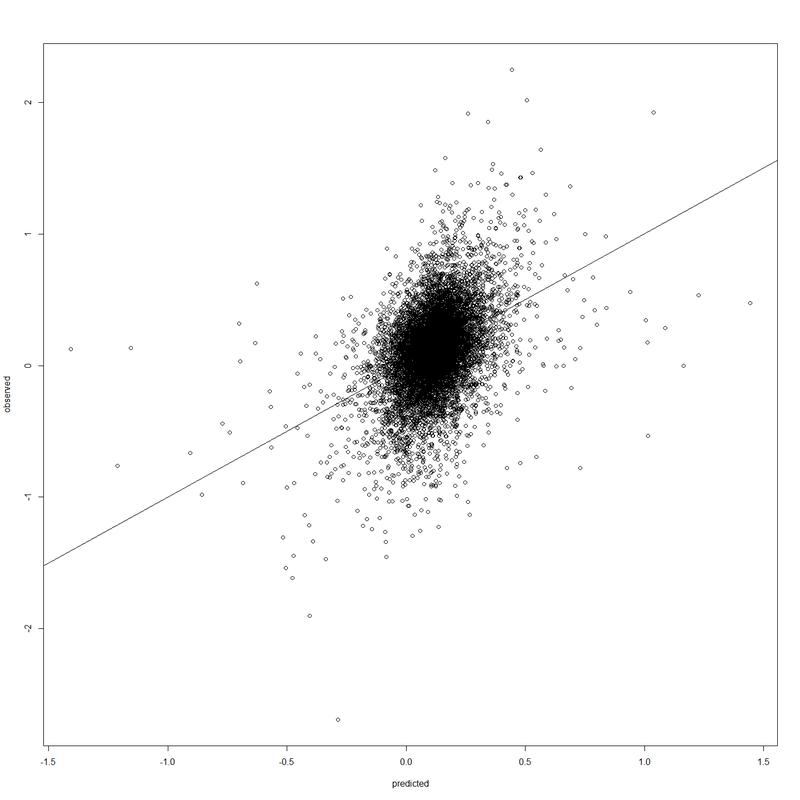
I originally addressed the issue of stock performance prediction in a post on March 13 of this year. This update takes note of an improved model which now can predict 16.3% of the variability in stock prices. Put another way, the correlation between observed stock performance and that predicted by the model, as shown in the graphic above, is about .404, a major improvement on the previous model. The current model is based on just 7 variables that are available from public sources such as financial websites.
The model is validated in various ways. We note first that all variables remaining in this model are highly significant (p < .000002). Also, residuals are mound-shaped and symmetric (though not quite normal), and Cook's distance is within acceptable bounds. Finally, cross-validation was employed, yielding satisfactory results.
Don't worry if you don't follow the technicalities. The point is that the model is statistically sound, assuming the validity of the original data (which does constitute a somewhat biased sample).
Past performance is never a guarantee of future results. The nature of statistics is such that I can't tell you the exact price of your favorite stock one week from today. But given a large enough set of stocks, and a long enough period of time, this model predicts that stocks with certain characteristics will perform better, on average.
 RSS Feed