OK, it doesn't get any better than this - presidential primaries and the Super Bowl! Let's get started.
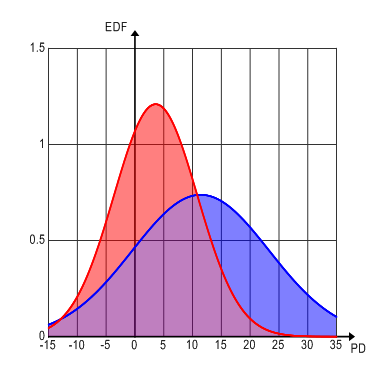
The above graph represents a normal approximation to the victory margins achieved by the Carolina Panthers (blue) and Denver Broncos (red) this season. The call: Carolina by 7-8 points. 95% prediction interval: anywhere from a 35-point victory by Carolina to a 20-point victory by Denver. Last year, my model called the correct winner, and the actual victory margin differed from the predicted by just 2 points!
Next, let's call the Iowa caucuses, based on polling data from the last 4 weeks in Iowa.
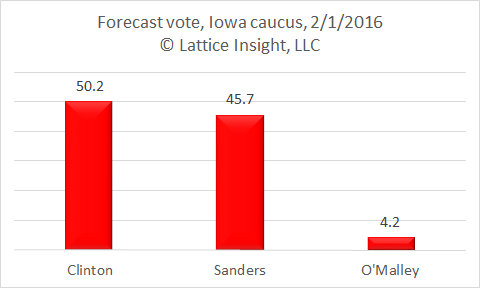
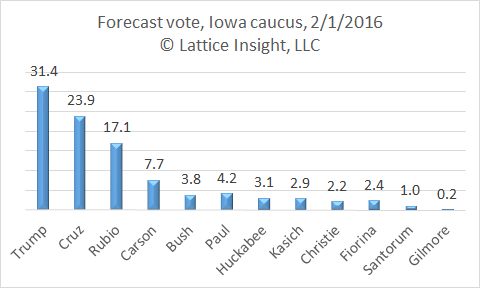
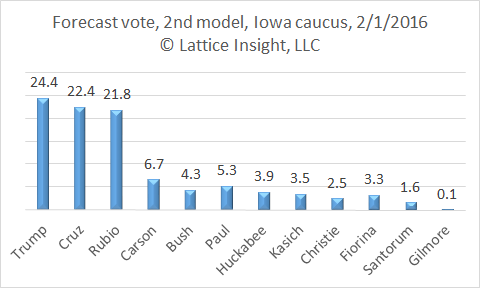
The data labels show the predicted vote shares by the 3 Democrat and 12 Republican candidates in Iowa; all numbers have a margin of error of 4.5 points. Clinton should achieve a 4.5-point victory over Sanders, while Trump scores a 7.5-point victory over Cruz. Based on the Zipf's law model we discussed in an earlier post, it appears that Sanders is mounting a very strong challenge to Clinton, as are both Cruz and Rubio to Trump.
We hope to analyze the data after the vote, to see which of the polls - or the forecast above - made the most accurate call, as well as to see which types of polling may be more accurate.
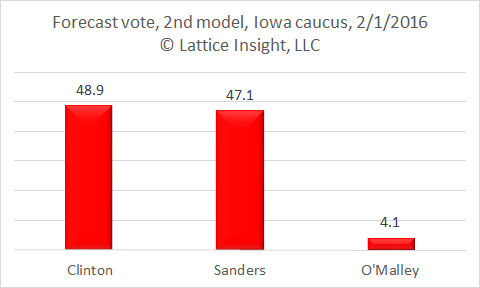
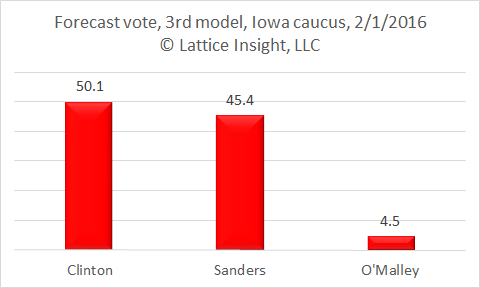
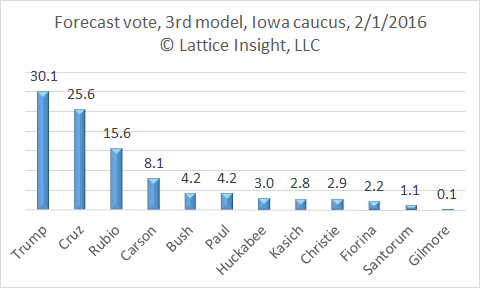
Update (later the same day): I have a new model capable of detecting changing direction in the polls. If the new model is correct (and we'll discuss that after the voting), the margin for Clinton will be a mere 1.7 points, while Trump barely edges out Cruz by 2.0 points, in a near 3-way tie with Rubio. Below are the graphs - check back to see which model was more accurate.
We hope to analyze the data after the vote, to see which of the polls - or the forecast above - made the most accurate call, as well as to see which types of polling may be more accurate.
Update (later the same day): I have a new model capable of detecting changing direction in the polls. If the new model is correct (and we'll discuss that after the voting), the margin for Clinton will be a mere 1.7 points, while Trump barely edges out Cruz by 2.0 points, in a near 3-way tie with Rubio. Below are the graphs - check back to see which model was more accurate.
OK, one more update, one more model. We'll see tomorrow how this model fares against the other two and the polls and the results.
 RSS Feed