It's the question without an obvious answer in cluster analysis: into how many clusters should we group our data? You are lucky if the data groups into a small number of visible, compact clusters that are clearly distinct from one another. Usually the choice is ambiguous, often depending on the clustering method used.
I am a big fan of Ward's method of clustering. The dendrograms associated with Ward's method lend themselves to fairly obvious recommendations for the number of clusters, because the higher branches tend to be the longest, especially in comparison to dendrograms arising from other agglomerative hierarchical clustering methods. (In technical terms, dendrograms arising from Ward's method tend to have larger agglomerative coefficients, closer to 1, compared with complete linkage [2nd best], average linkage [3rd best], and single linkage [the worst].)
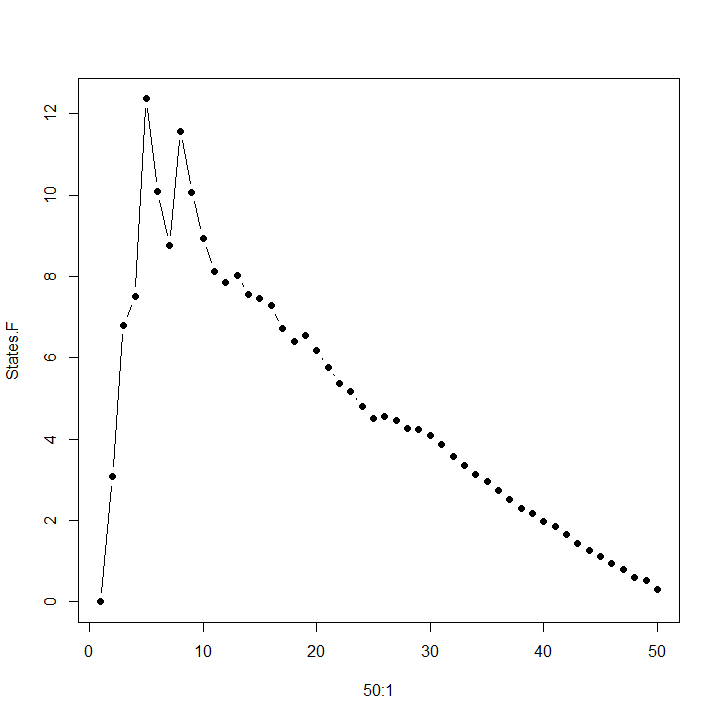
The Calinski-Harabasz pseudo-F statistic tries to explain the most variation between clusters using the fewest clusters, employing a formula that suspiciously resembles an F-statistic. When the data is multivariate normal and the clustering method is Ward's, the pseudo-F statistic is in fact an F-statistic!
Typically we try to maximize the pseudo-F statistic. For one dataset I studied recently, the maximum occurred at k = 5 clusters, as shown in the graph above, with k = 8 a close second. The dendrogram reveals that 5 clusters and 8 clusters are natural choices for this data.
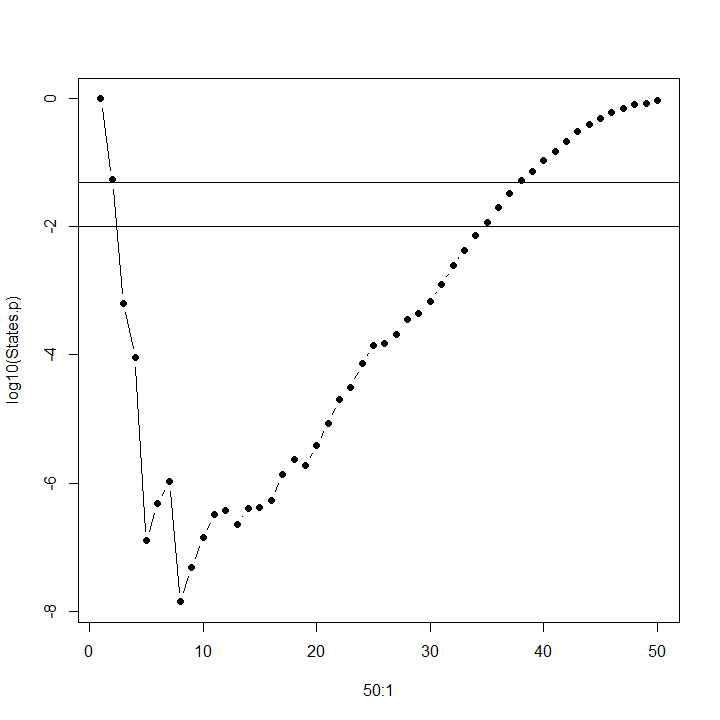
But when the pseudo-F statistic is in fact an F-statistic, an alternative is to determine the p-value for the F-values above, and choose the number of clusters that minimizes p, giving us the most significant value of k. In the graph below, the partitioning of variance among 8 clusters is more significant than among 5 clusters. (Horizontal lines on this graph of log p show the location of p = .05 [upper] and p = .01 [lower].)
I am a big fan of Ward's method of clustering. The dendrograms associated with Ward's method lend themselves to fairly obvious recommendations for the number of clusters, because the higher branches tend to be the longest, especially in comparison to dendrograms arising from other agglomerative hierarchical clustering methods. (In technical terms, dendrograms arising from Ward's method tend to have larger agglomerative coefficients, closer to 1, compared with complete linkage [2nd best], average linkage [3rd best], and single linkage [the worst].)
The Calinski-Harabasz pseudo-F statistic tries to explain the most variation between clusters using the fewest clusters, employing a formula that suspiciously resembles an F-statistic. When the data is multivariate normal and the clustering method is Ward's, the pseudo-F statistic is in fact an F-statistic!
Typically we try to maximize the pseudo-F statistic. For one dataset I studied recently, the maximum occurred at k = 5 clusters, as shown in the graph above, with k = 8 a close second. The dendrogram reveals that 5 clusters and 8 clusters are natural choices for this data.
But when the pseudo-F statistic is in fact an F-statistic, an alternative is to determine the p-value for the F-values above, and choose the number of clusters that minimizes p, giving us the most significant value of k. In the graph below, the partitioning of variance among 8 clusters is more significant than among 5 clusters. (Horizontal lines on this graph of log p show the location of p = .05 [upper] and p = .01 [lower].)
 RSS Feed