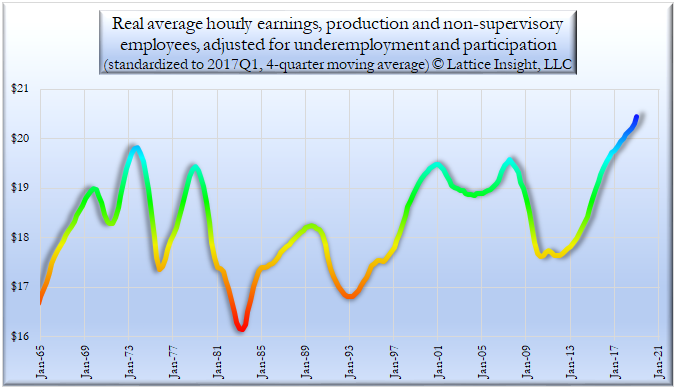
We address the earnings power of American workers, using data from FRED, the research arm of the St. Louis Federal Reserve Bank. We consider the average hourly earnings of production and non-supervisory employees; this might be considered as the lower and middle economic classes. We adjust their wages for inflation (this makes it "real") by dividing out the value of the Consumer Price Index, standardized so that the index in 2017Q1 equals 1.
We penalize our new metric for low labor force participation and for high unemployment. We estimate U6 underemployment, which was measured officially only since 1994, by multiplying the standard U3 unemployment rate by 2. The U6/U3 ratio has remained close to 2 during the Obama and Trump administrations. We display the 4-quarter moving average of the results.
This metric's previous peak was in 1973Q4. This record was approached, but not broken, in 2001Q1 and 2007Q3. The previous record was broken in 2017Q2 and has continued to increase since then. It would appear that the purchasing power of the lower and middle economic classes is now at record levels, even when adjusted for inflation, unemployment, underemployment, and lack of labor force participation.
 RSS Feed